What it is
Compares recruiters/teams on activity and throughput — candidates added, applications made, and movement through the pipeline.
Who can use it
All roles.
Where to find it
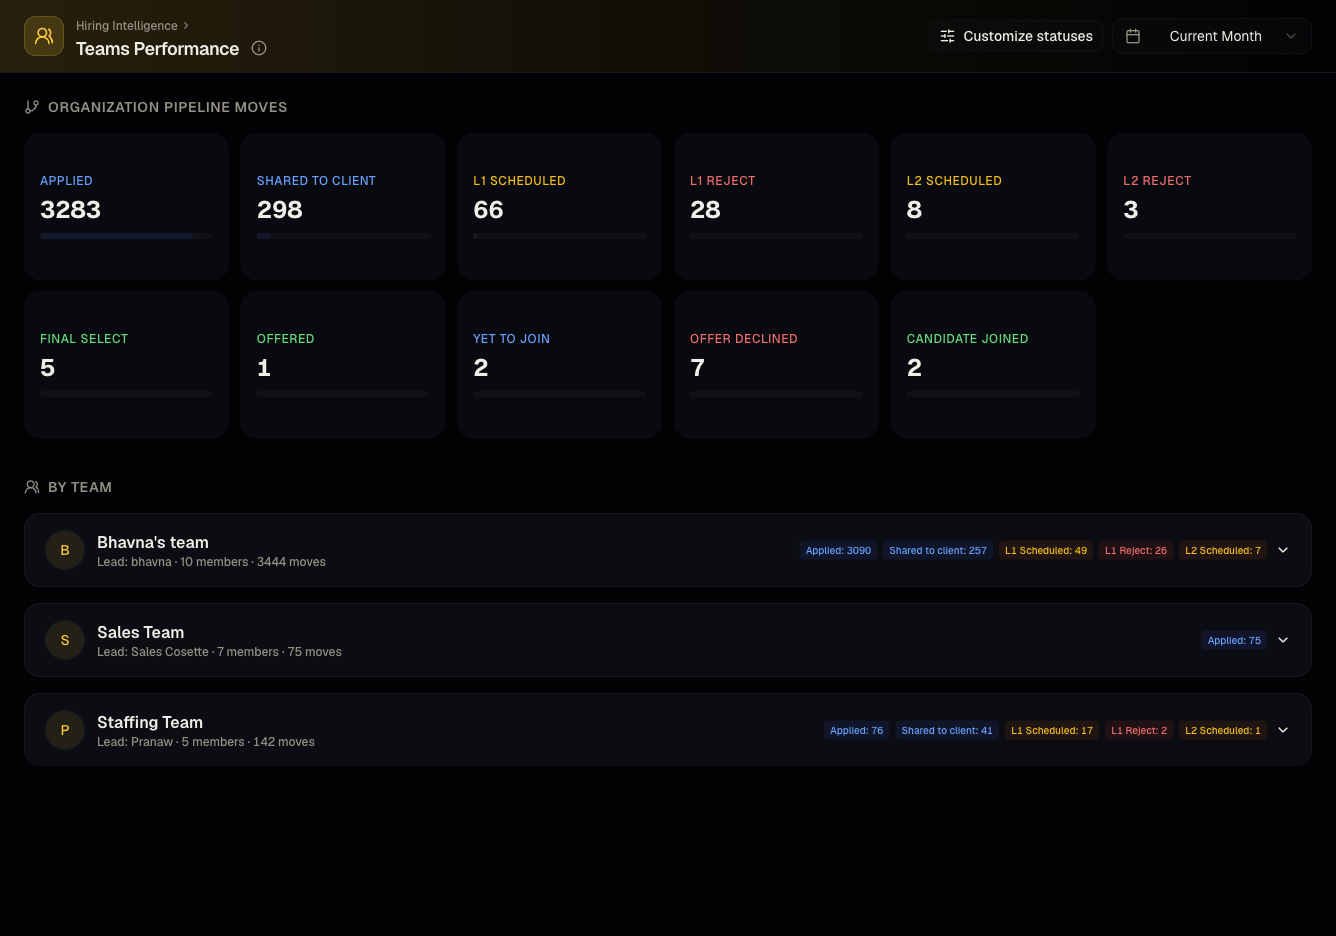
Steps
- Set a date range.
- Compare individual recruiters or teams side by side.
Good to know
- Numbers reflect pipeline activity attributed to each user — a recruiter who mostly supports others (reviewing, scheduling) without shortlisting candidates directly may show lower throughput than their actual contribution.
- Team groupings here depend on team assignments being kept up to date by an admin.
Common questions
- Does this include AI Calling Agent activity? Check the metrics shown — this report focuses on pipeline/recruiting activity; use AI Calling logs for calling-specific data.
- Can I compare individuals within a team, not just teams against each other? Yes, drill into a team to see its members' individual throughput.
- Is this visible to members, or admin-only? All roles can view it — it's an analytics report, not an administrative control.
- What counts as "throughput" here? Generally candidates moved forward through pipeline stages over the selected period, not just raw candidate-add counts.
Related articles
Last updated: 9/17/20265 views